
Large market swings can be unsettling for some, particularly when their portfolios are losing value.
Moving portfolios into cash during times of turbulence can often lead to lower long-term returns than simply staying invested.
These visual aids can help reassure you to stay the course and maintain a long-term focus when markets are volatile.
Don’t let turbulence distract you. Keep your focus on the longer term
Short-term volatility is a normal part of investing. This chart shows that, despite periods of high volatility that have often coincided with market pullbacks, equity markets have climbed over the long term:
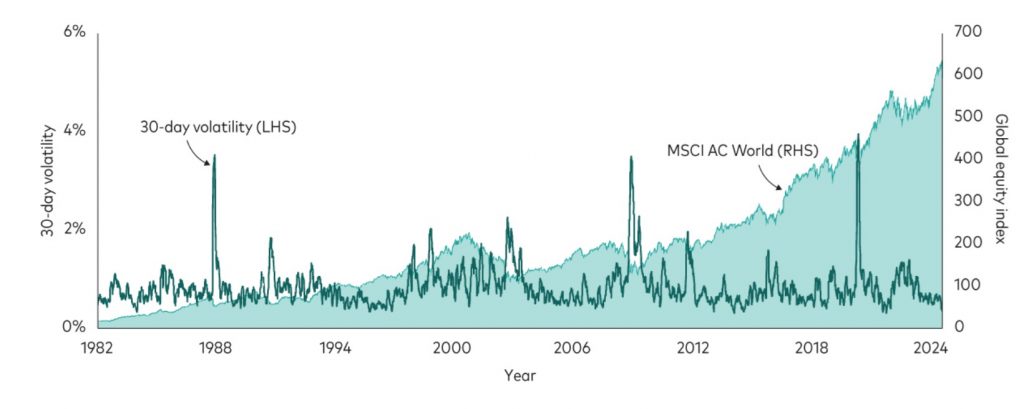
Notes: The chart shows the trailing 30 business day volatility of daily returns (LHS) and the price index (RHS) of the MSCI World Price Index from 1 January 1982 to 31 December 1987 and the MSCI AC World Price Index thereafter. Source: Calculations in GBP, based on data from Refinitiv, as at 3 July 2024.
Downturns aren’t Rare Events. Typical investors will endure many of them during their lifetime
Bear markets and corrections are a part of life for investors, who are best served by maintaining a long-term focus.
Since 1972, there have been eight bear markets in global equities, from a sterling investor’s perspective. History shows that equities typically recover and go on to post strong results over the medium to longer term.
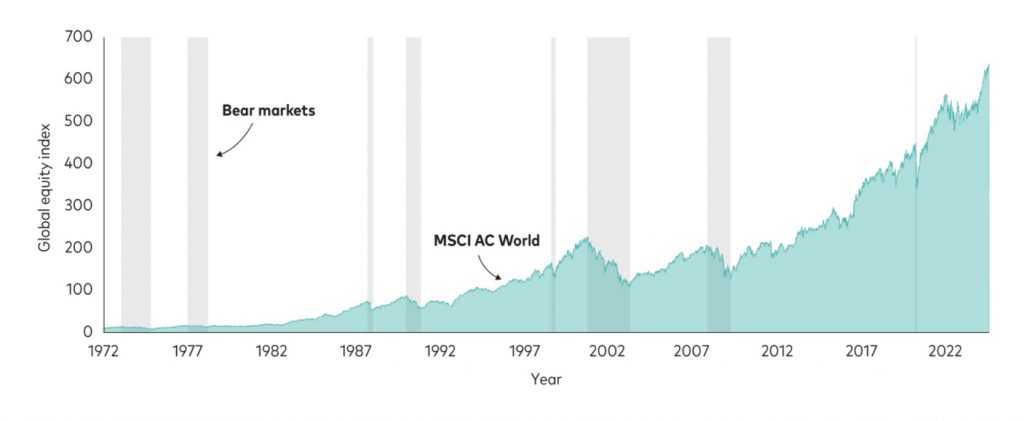
Notes: The chart shows the MSCI World Price Index from 1 January 1972 to 31 December 1987 and the MSCI AC World Price Index thereafter. The shaded areas represent bear markets, defined as price decreases of more than 20% from the previous peak to the trough. Source: Calculations in GBP, based on data from Refinitiv, as at 3 July 2024.
Timing the Market is Futile. The best and worst trading days often happen close together
One reason investors shouldn’t try to time the market is they run the risk of missing out on strong performance, which can seriously hamper long-term investment success.
Historically, the best and worst trading days have tended to cluster in brief time periods, often during periods of heightened market uncertainty and distress, making the prospect of successfully timing the market improbable.
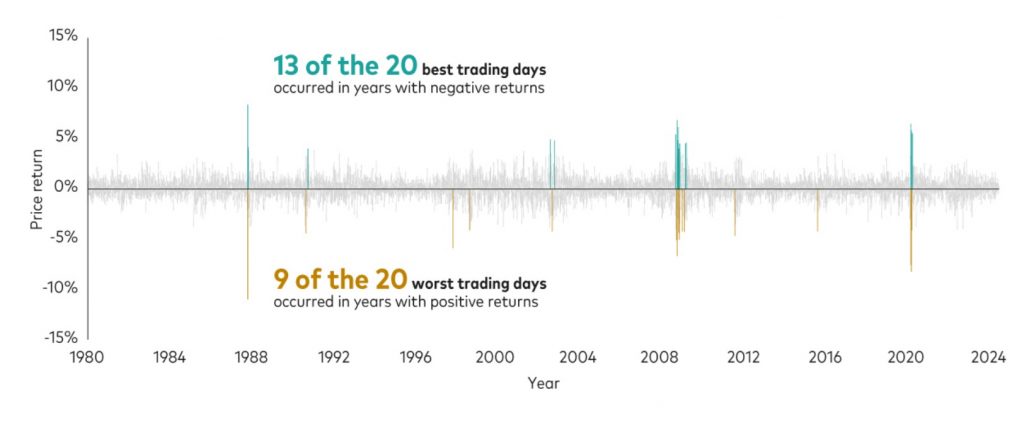
Notes: The chart shows daily returns of the MSCI World Price Index from 1 January 1980 to 31 December 1987 and the MSCI AC World Price Index thereafter. The green bars highlight the 20 best trading days since 1 January 1980 and the gold bars highlight the 20 worst trading days since 1 January 1980. Source: Calculations in GBP, based on data from Refinitiv, as at 3 July 2024.
Don’t Panic-sell During Market Turmoil
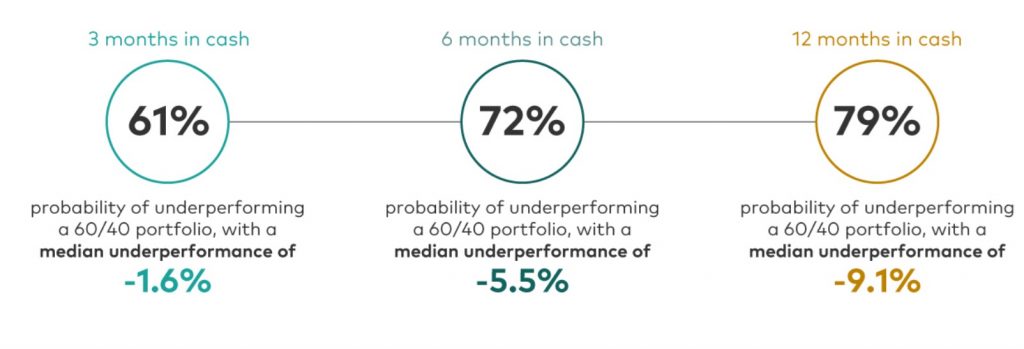
Fast and significant market downturns are infrequent. When they do occur, investors can feel frightened and move their portfolios into cash – an action made doubly challenging by then having to pick the right time to move back into the market. Long periods out of the market can end up making matters worse.
Past performance is not a reliable indicator of future results.
Notes: The chart shows the distribution of excess returns of cash over a global 60% equity / 40% fixed income portfolio for the 3-, 6- and 12-month periods after 2-month total returns of global equities were below 5%. For example, global equity returns from 31 August 2008 to 31 October 2008 were -20.74%. Over the following 3-month period until 31 January 2009, cash returned 0.84%, while the 60/40 portfolio returned 1.76%, so that the excess returns of cash were at -0.93%. Equity comprises global equity (MSCI AC World Total Return Index). Fixed income comprises hedged, global bonds (Bloomberg Global Aggregate Bond Index Sterling Hedged). Cash is represented by Sterling 3-months deposits. Data based on the period between 31 January 1990 and 30 June 2024. Source: Calculations in GBP, based on data from Refinitiv, as at 3 July 2024.
What to Do When Volatility Hits
Use these four simple investing tips to help you avoid overreacting to short-term downturns and stay on course for long-term investment success.
- Tune out the noise – There’s an old adage that you should never check your account when stocks are tanking. It’s smart advice. As the charts above show, making a hasty decision usually results in an investment mistake.
- Revisit your asset allocation – If market corrections are making you lose sleep, it may be time to re-evaluate your risk tolerance.
- Set realistic expectations – Historical return averages are simply that–averages–and returns could be lower in any given year.
- Stay diversified – A great way to insulate your portfolio is to have exposures to stocks, bonds and international markets in an asset allocation plan that makes sense for your risk tolerance and goals. Bonds can act as a ballast during downturns. International exposure can give you access to markets that may generate positive performance when others are falling.
Needless to say, if you have any comments or queries about these points, do not hesitate to let us know, and at times of volatility, advice can be key: